Overview
The Query Lineage section provides an organized, directed graph view of the tables, views, and nested queries involved in your query. This graph, displayed below the query editor, shows all tables, views, and other queries your query directly references. When a query references another query, all levels of dependencies within those queries are shown. For views, lineage stops at the first-level reference, offering a streamlined view without tracing further nested dependencies.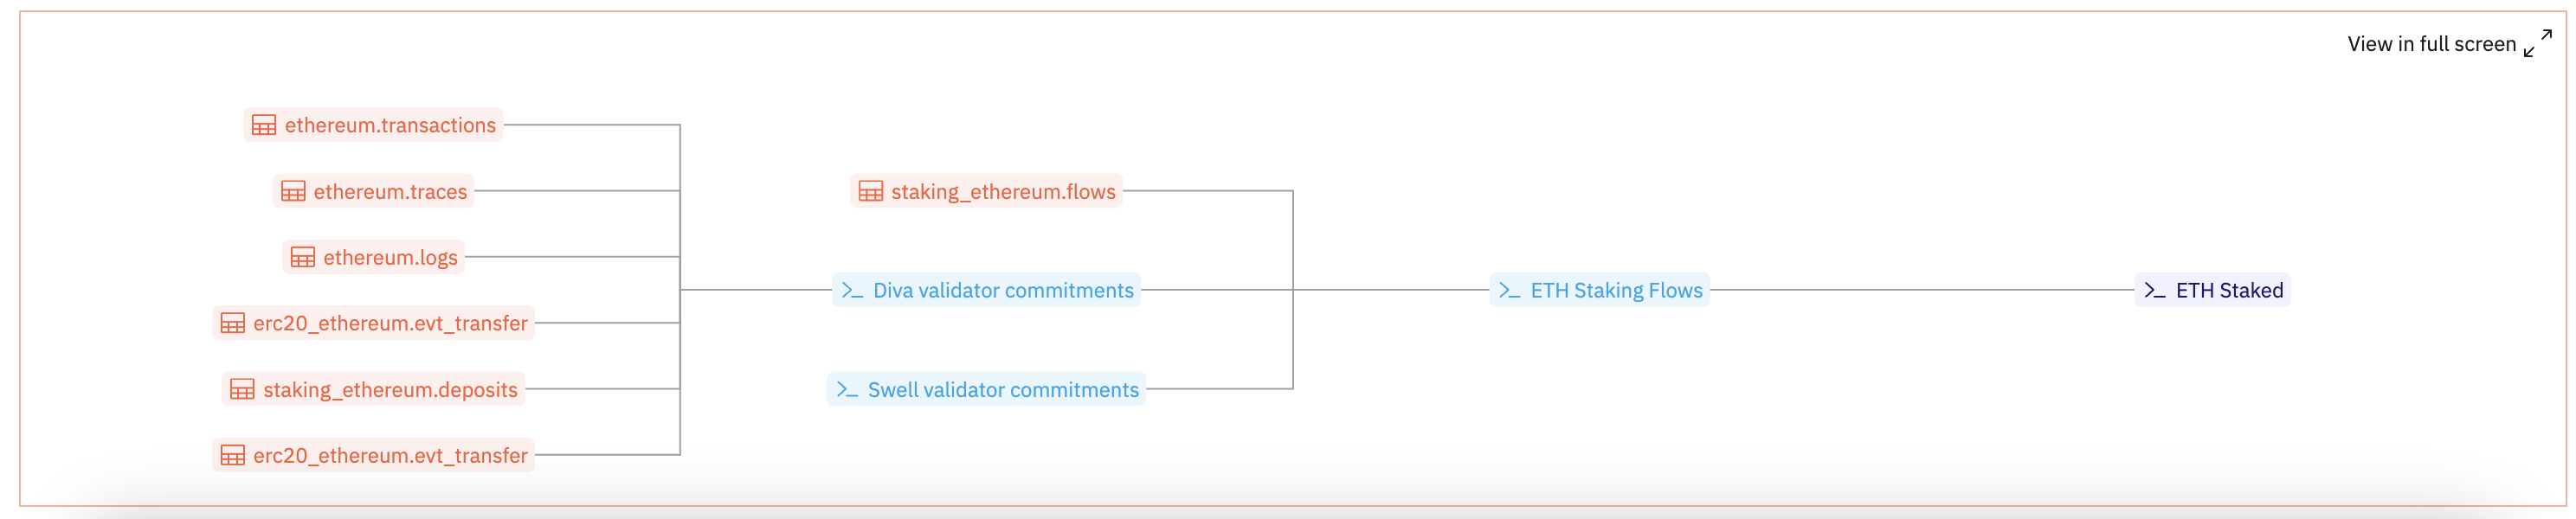
Key Features
- Interactive Graph Navigation: Click through queries, tables, and views directly from the lineage graph to explore definitions.
- Comprehensive Query Lineage: Trace all levels of referenced queries to see the full path of data dependencies.
- Simplified View Lineage: Limit view lineage to the first level, reducing complexity in multi-layered dependencies.
How Query Lineage Works
- Full Query Lineage: For each query, Query Lineage displays all tables, views, and queries it references. If a referenced query itself references additional queries or tables, those are also shown, providing the complete chain of dependencies.
- Limited View Lineage: For views, Query Lineage includes only the first-level reference. If a view references another view or table, further dependencies within those views are not displayed, offering a concise overview.
Accessing Query Lineage
To view a query’s lineage:- Open a query in Dune’s Web App.
- Navigate to the Query Lineage section below the query editor and next to the visualizations.
- A directed graph of the query’s lineage will appear, with clickable links for each referenced query, table, or view.