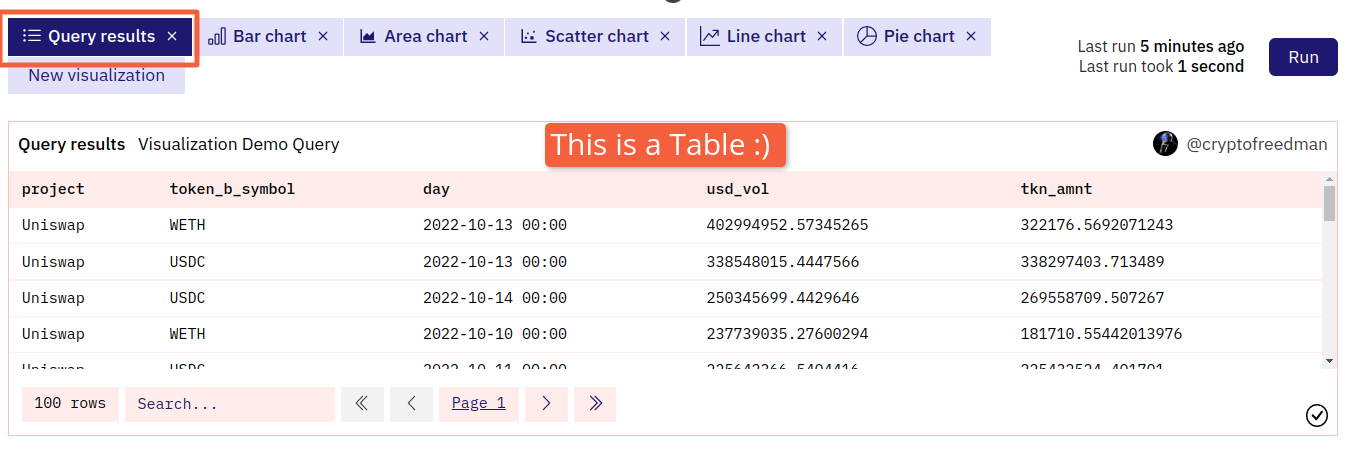
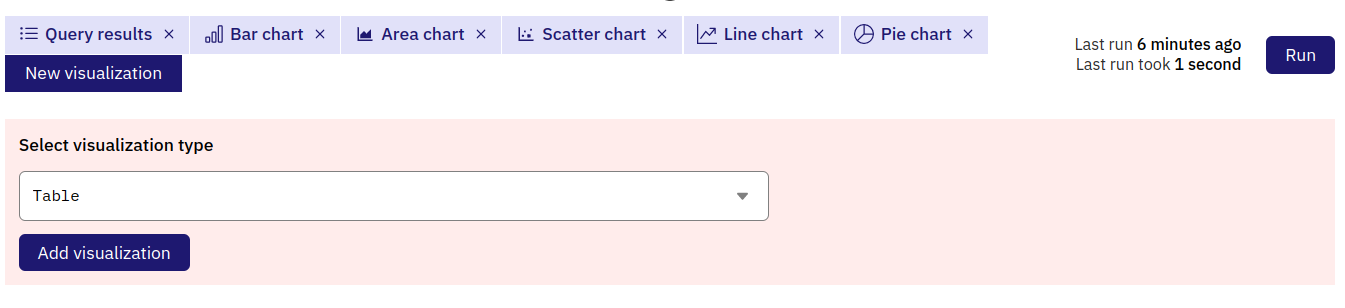
Configuring your Table
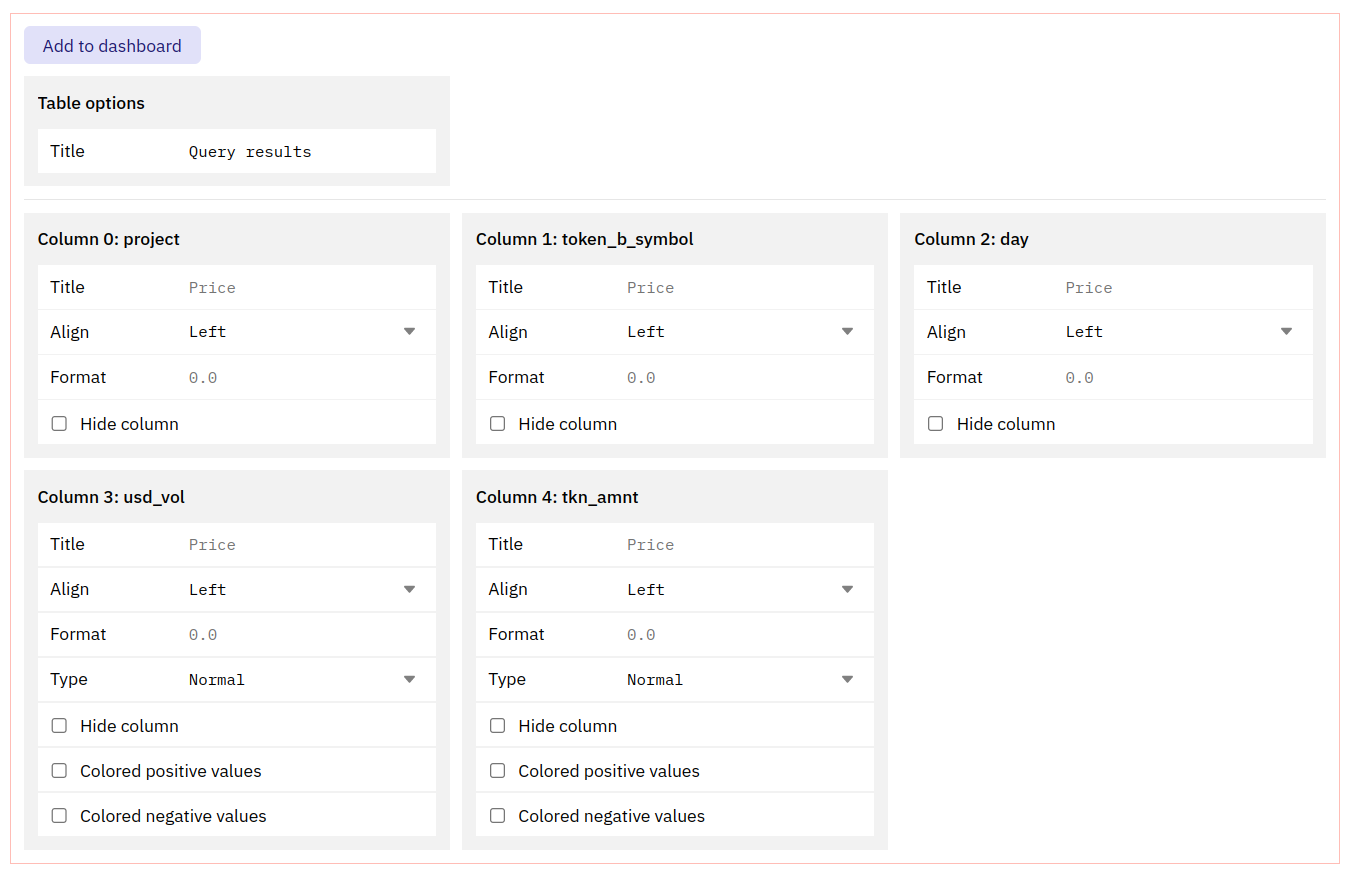
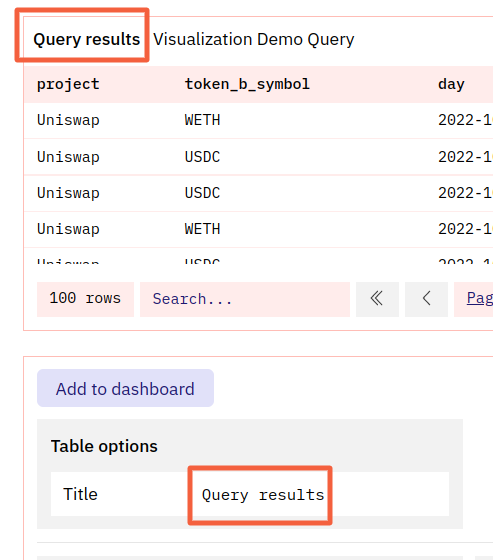
Table options
Title The Title appears at the top of your Table. Leaving default value (Table) or making this blank makes your Table title the same as your Query’s title/name.
Adding any other value to this field will add that value first, followed by your Query Name:
”Column [x]:” options
You can configure the following options for each column in your Table
- Title
- Align
- Format
- Hide Column
The Title appears at the top of your Table.Leaving this blank makes your column title the same as its Dune database name.
Numerical Column options
Columns that return numerical data have these additional options:- Type
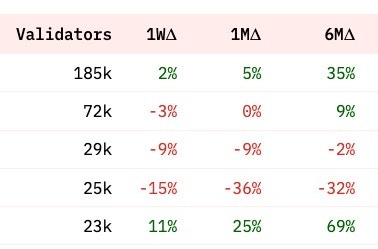
- Colored Values
-
Normalsimply displays the column’s numerical data. -
Progress barshows the column’s numerical data with a progress bar visual that is “full” for the column’s highest value and “nearly empty” for the column’s lowest value, with the rest of the data ranging in between: